

If you've purchased a Hydrom digital hydrometer, one of the recommended and easiest platforms to integrate with is Ubitdots Stem. It's free and allows you to easily create awesome looking graphs to display your fermentation data.
Here's a step by step guide on how to get your Hydrom configured and integrated with Ubidots Strem.
- Setup a free account at https://ubidots.com/stem/
- Once ypu've created your account and signed in, select Devices > Devices from the top menu

- Click the blue "+" button in the upper right corner then select the "+" button again to Add new device

- Select the option for Blank Device

- Enter the Device Name and Device Label into the respective fields. These fields determine how the Hydrom will appear in the device list within Ubidots. We went with "Hydrom001" but you can use whatever device name you like.
Click the green tick in the lower right corner to proceed.
- You will now be returned to the Devices page. Click on the name of the device you just added to open the device properties page

- From the device properties page, click the button indicated below to copy the unique Token field to the clipboard

- Next, we simply need to paste this Token value into the Ubidots service within the Hydrom configuration.
- Unscrew the lid of your Hydrom. Ensure the On/Off switch is set to the On position, then press the Reset button to initiate the web portal interface.

- If you're connecting directly then connect to the Hydrom SSID, then open a web browser and navigate to http://192.168.2.1
If you have configured the Hydrom to connect to your home WiFi network, then you'll need to determine what IP address the Hydrom has and connect to the web interface using that address. - Once you've accessed the Hydrom web interface, click the menu icon in the top left corner then select Services

- From the list of Services, locate the option for Ubidots and toggle the slider to enabled position

- Paste the Token value you copied from Step 7 into the field that appears

- Also toggle the Test Message slider to On, then click the Save button at the bottom of the screen. This will force a test message to Ubidots straight away so we can check/confirm the integration has worked correctly.
- Go back to Ubidots and open the Device Properties page again. You should see data populated similar to the screenshot below

- This screen will show all the fields that the Hydrom is reporting, the last reported values, and when the last values were reported. Next, we'll create a dashboard with some widgets to display our data.
- Select Data > Dashboards from the top menu

- Select the option to Add new Dashboard

- Give your dashboard a name, then click Save

- Click in the box to Add new widget

- We'll create a simple line graph first to show our gravity reading history. Select the option for Line chart from the list of available widgets

- Click the button to Add Variables

- Select your Hydrom device then select the option that appears for specific-gravity. Click the green tick in the bottom right corner to save

- Click the green tick button again to save and create your chart

- Your chart will now display on the dashboard. You can resize the chart by clicking the bottom right corner and dragging to resize.
You can also change the colour, and scale of the graph by using the menu icon in the upper right icon of the widget then selecting Edit.
You can then repeat the process of creating additional widgets by clicking the blue "+" button in the right corner, then repeating from Step 21 above for whatever widget type and data metrics you wish to use

Here are some example widgets we created to give you some ideas


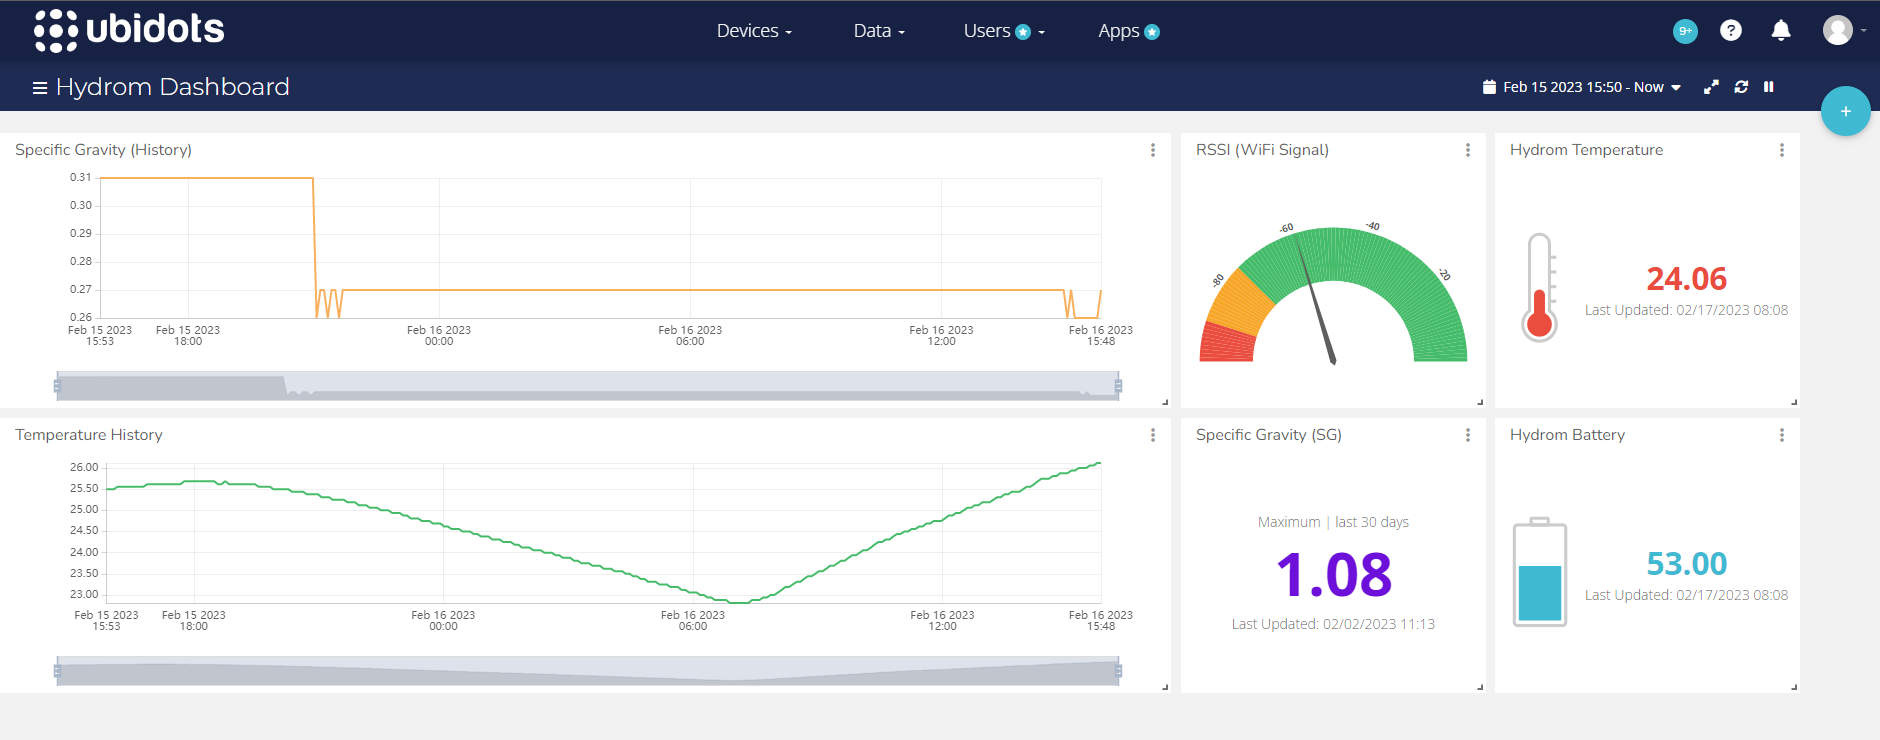
As you can see, the Ubidots platform is incredibly powerful, and you're able to create some cool looking graphs and other widgets to display your Hydrom data in a useful manner.
You do need to tweak some of the graph settings like their scales and colour sometimes as the default options don't always look as good as they could, but the interface is clear and intuitive to use.
.png)


No comments:
Post a Comment